|
Figure8.gif (icon)
|
[6.54 KB]
17 Apr 2025, 11:44
|
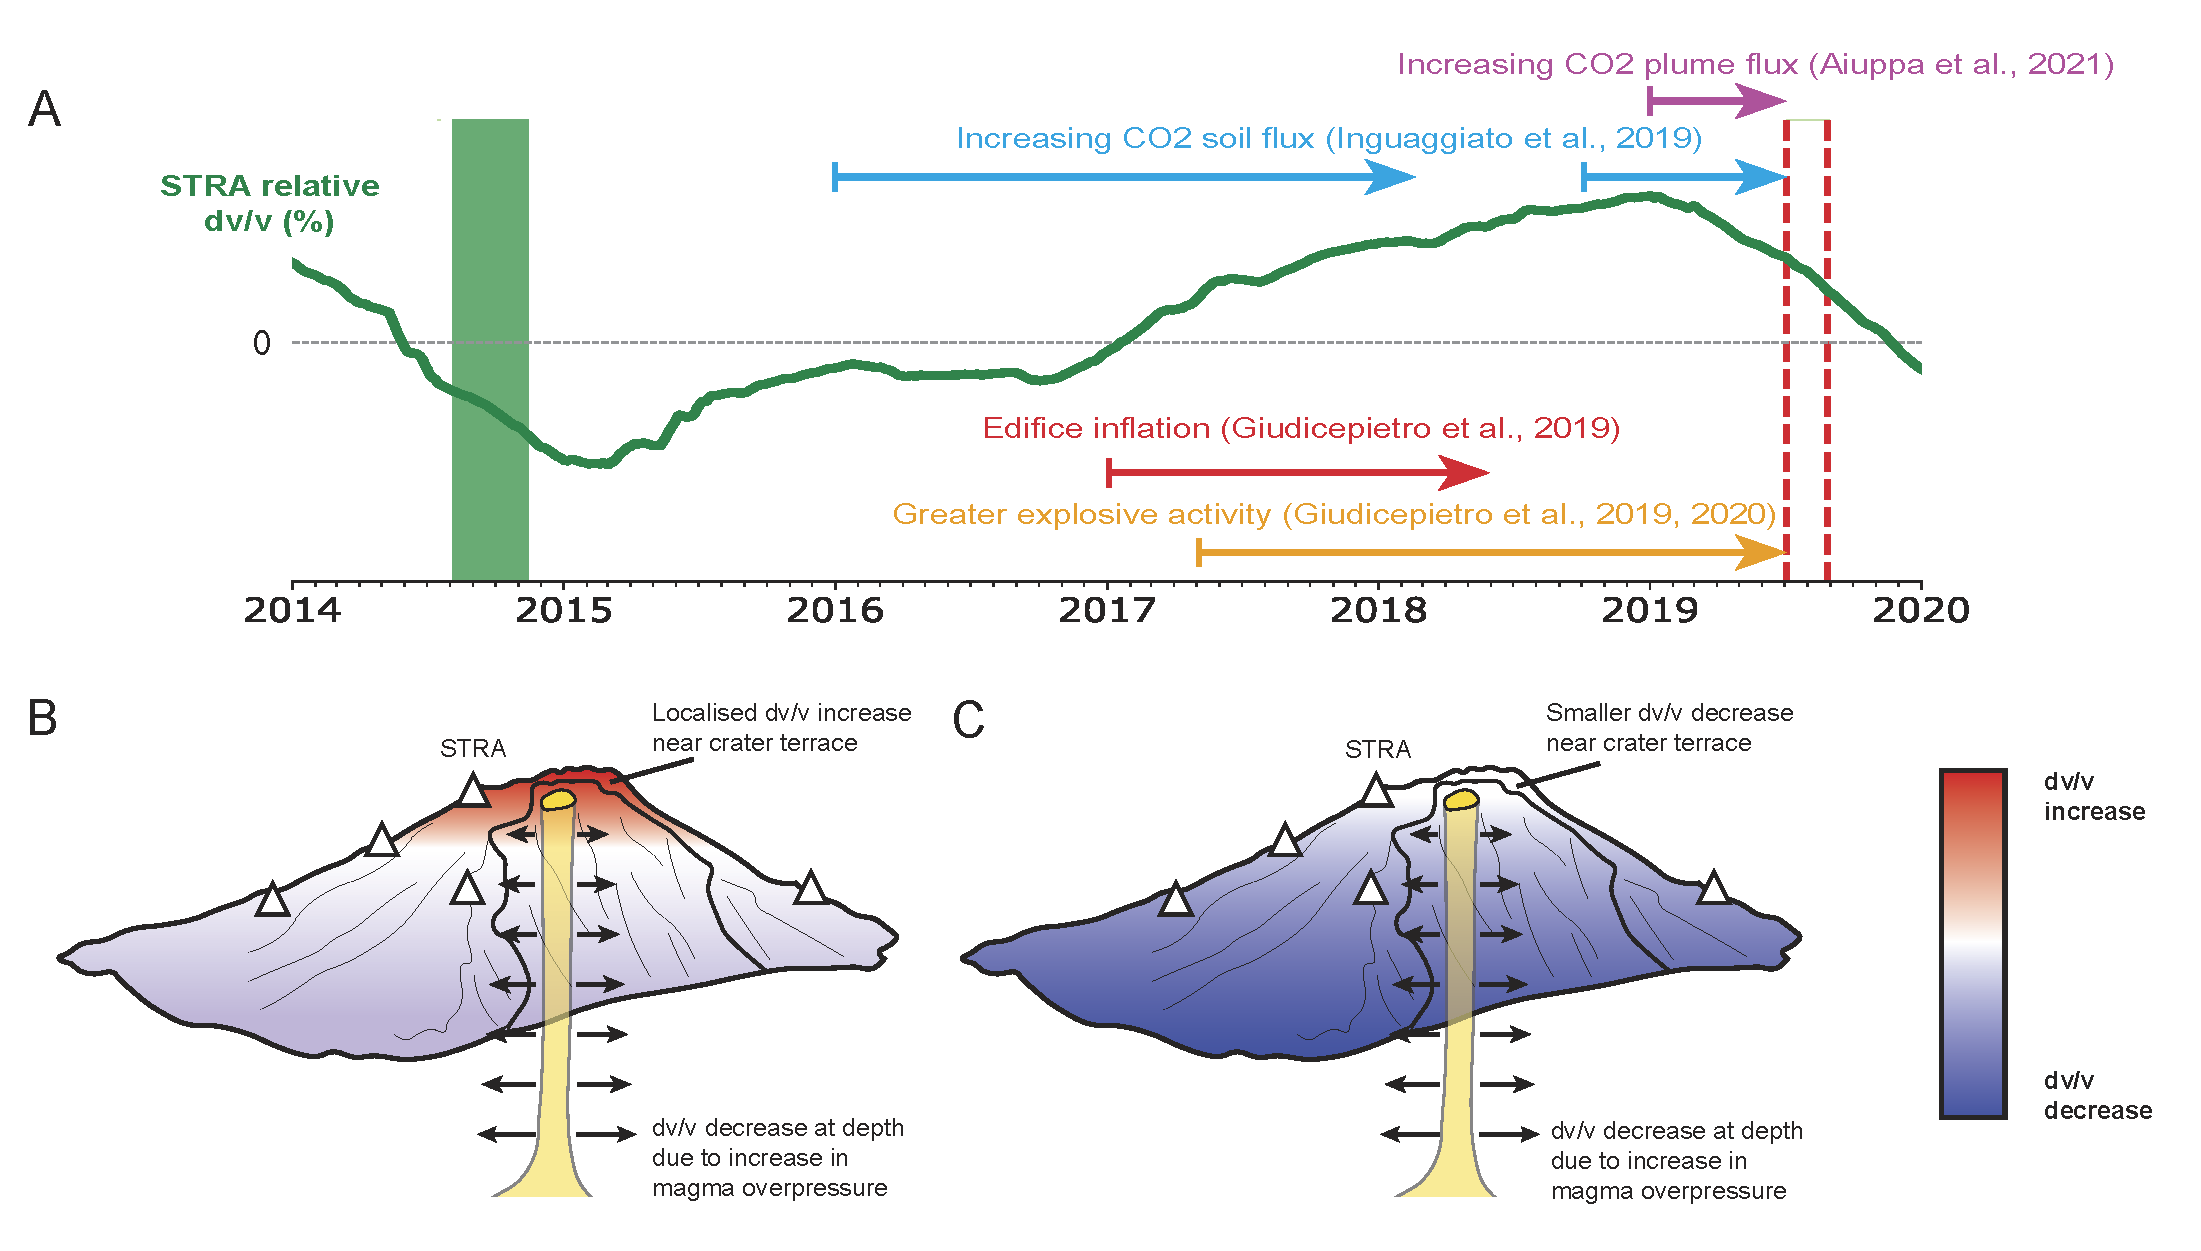
Various mid-to-long term observations at Stromboli and two conceptual models that may explain relative increase at STRA station in response to increased magma overpressure. [A] Observations at Stromboli prior to 2019 paroxysms compared with relative increase of velocity at STRA station (smoothed using 365-d moving window for visual simplicity). Red-dashed-lines = paroxysms, dark-green shading = 2014 flank eruption. [B] Model one: Local velocity increase near the crater terrace with velocity decrease at depth. [C] Model two: Broad velocity decrease, with reduced influence near the crater terrace. |
|
Figure8.jpg (icon-180)
|
[8.02 KB]
17 Apr 2025, 11:44
|
Various mid-to-long term observations at Stromboli and two conceptual models that may explain relative increase at STRA station in response to increased magma overpressure. [A] Observations at Stromboli prior to 2019 paroxysms compared with relative increase of velocity at STRA station (smoothed using 365-d moving window for visual simplicity). Red-dashed-lines = paroxysms, dark-green shading = 2014 flank eruption. [B] Model one: Local velocity increase near the crater terrace with velocity decrease at depth. [C] Model two: Broad velocity decrease, with reduced influence near the crater terrace. |
|
Figure8.png
|
[70.45 KB]
17 Apr 2025, 11:43
|
Various mid-to-long term observations at Stromboli and two conceptual models that may explain relative increase at STRA station in response to increased magma overpressure. [A] Observations at Stromboli prior to 2019 paroxysms compared with relative increase of velocity at STRA station (smoothed using 365-d moving window for visual simplicity). Red-dashed-lines = paroxysms, dark-green shading = 2014 flank eruption. [B] Model one: Local velocity increase near the crater terrace with velocity decrease at depth. [C] Model two: Broad velocity decrease, with reduced influence near the crater terrace. |
 Figure8