|
Screenshot 2025-04-17 113943.gif (icon)
|
[11.77 KB]
17 Apr 2025, 11:41
|
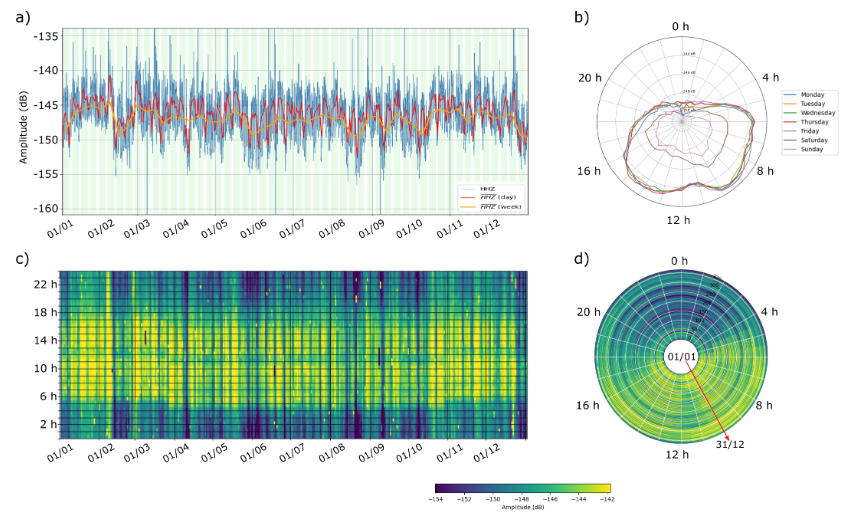
Graphical representations of the time variations of the power of the seismic acceleration amplitude for the 1.0-10.0Hz frequency band at station CCAS. Power amplitudes are expressed in dB, relative to 1 m2/s4/Hz. (a) RMS of the poweramplitude calculated every 30 minutes (blue line), averaged daily (red line) and averaged weekly (orange line). (b) Power amplitude variation averaged for each day of the week and represented as a function of the hour of the day. (c) Power amplitude variation, represented using a color palette, as a function of the hour of the day. (d) Idem, but represented in a circular graph. |
|
Screenshot 2025-04-17 113943.jpg (icon-180)
|
[9.25 KB]
17 Apr 2025, 11:41
|
Graphical representations of the time variations of the power of the seismic acceleration amplitude for the 1.0-10.0Hz frequency band at station CCAS. Power amplitudes are expressed in dB, relative to 1 m2/s4/Hz. (a) RMS of the poweramplitude calculated every 30 minutes (blue line), averaged daily (red line) and averaged weekly (orange line). (b) Power amplitude variation averaged for each day of the week and represented as a function of the hour of the day. (c) Power amplitude variation, represented using a color palette, as a function of the hour of the day. (d) Idem, but represented in a circular graph. |
|
Screenshot 2025-04-17 113943.png
|
[443.01 KB]
17 Apr 2025, 11:41
|
Graphical representations of the time variations of the power of the seismic acceleration amplitude for the 1.0-10.0Hz frequency band at station CCAS. Power amplitudes are expressed in dB, relative to 1 m2/s4/Hz. (a) RMS of the poweramplitude calculated every 30 minutes (blue line), averaged daily (red line) and averaged weekly (orange line). (b) Power amplitude variation averaged for each day of the week and represented as a function of the hour of the day. (c) Power amplitude variation, represented using a color palette, as a function of the hour of the day. (d) Idem, but represented in a circular graph. |
 Screenshot 2025-04-17 113943