|
jgrb55894-fig-0002-m.gif (icon)
|
[11.35 KB]
03 Dec 2024, 11:04
|
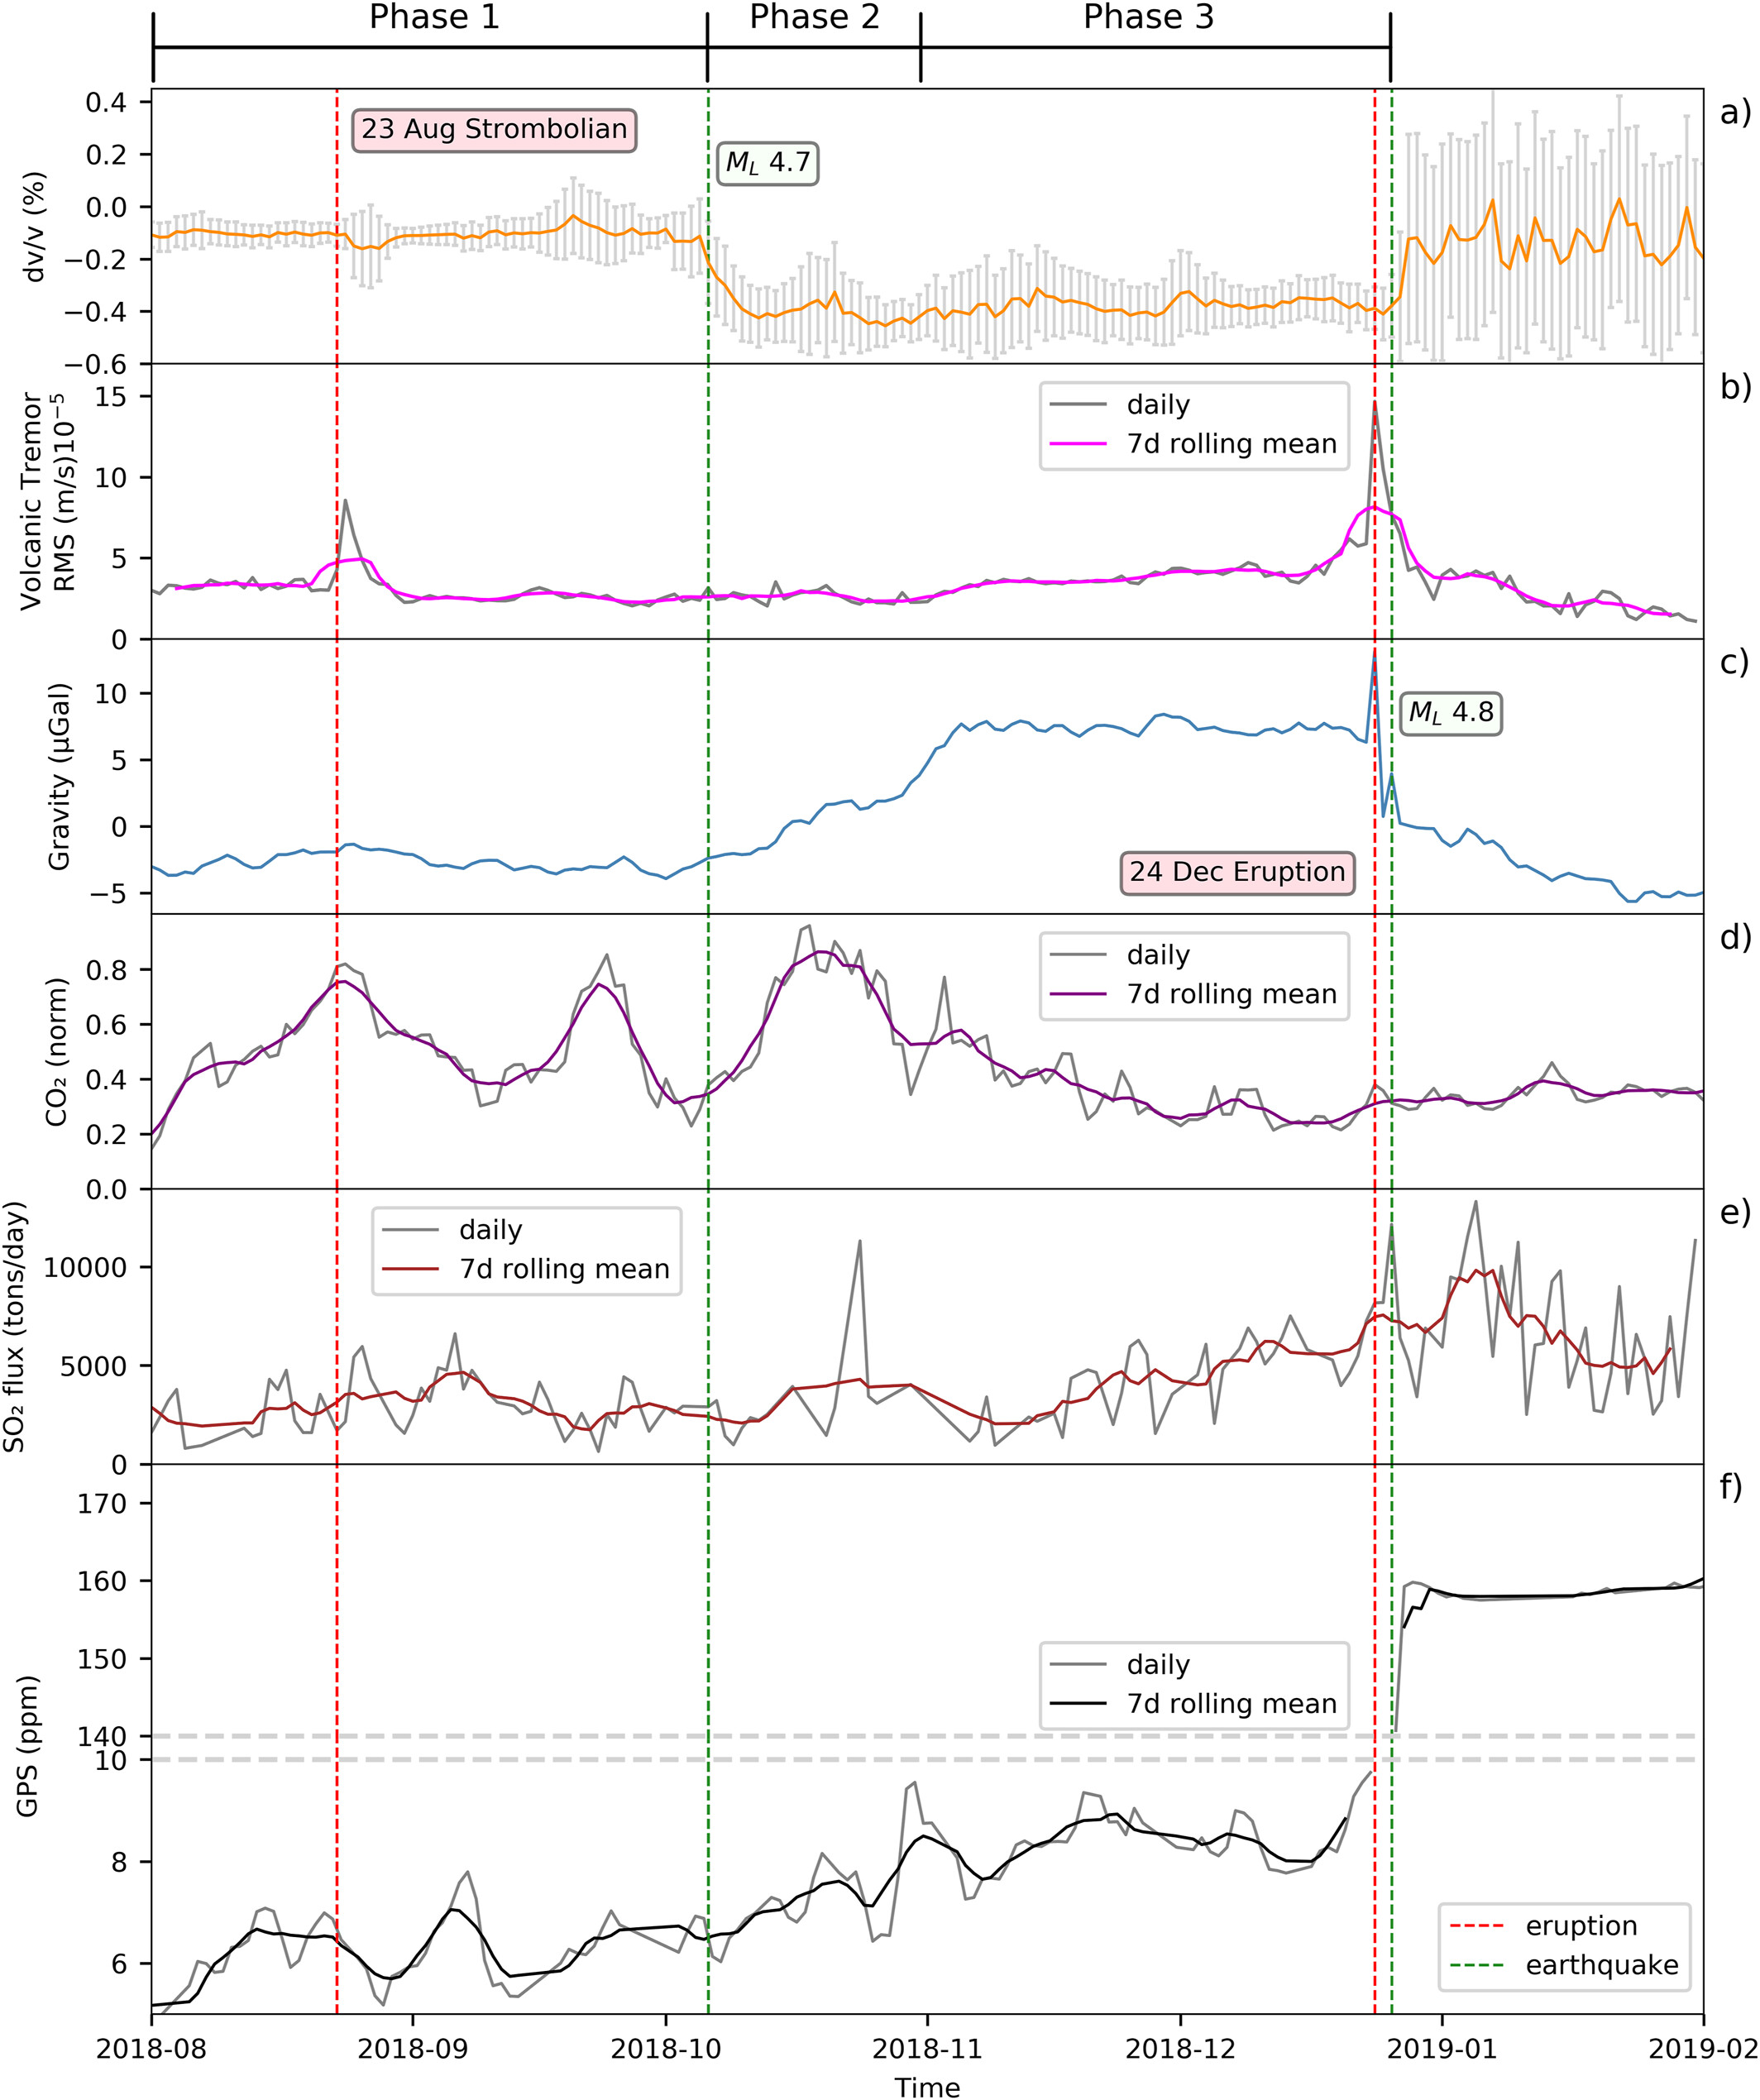
(a) Average velocity variation of 5-day moving window (dv/v) for all station pairs with its uncertainty (gray error bars). (b) Root Mean Square amplitude of volcanic tremor in velocity (m/s) filtered in the frequency band 0.5–2.5 Hz. (c) Gravity signal observed at SLN station (iGrav#16). (d) Normalized CO2 flux from the volcano flanks, measured by the EtnaGAS network. (e) The SO2 flux measured via FLAME network. (f) The areal strain of the summit area calculated using the EPLU, EPDN, ECPN, and EINT GNSS stations. The vertical dashed red lines show the 23 August Strombolian and 24 December eruption. The dashed green lines indicate the 6 October 2018 ML 4.7 and 26 December 2018 ML 4.8 earthquakes. |
|
jgrb55894-fig-0002-m.jpg
|
[520.96 KB]
03 Dec 2024, 11:03
|
(a) Average velocity variation of 5-day moving window (dv/v) for all station pairs with its uncertainty (gray error bars). (b) Root Mean Square amplitude of volcanic tremor in velocity (m/s) filtered in the frequency band 0.5–2.5 Hz. (c) Gravity signal observed at SLN station (iGrav#16). (d) Normalized CO2 flux from the volcano flanks, measured by the EtnaGAS network. (e) The SO2 flux measured via FLAME network. (f) The areal strain of the summit area calculated using the EPLU, EPDN, ECPN, and EINT GNSS stations. The vertical dashed red lines show the 23 August Strombolian and 24 December eruption. The dashed green lines indicate the 6 October 2018 ML 4.7 and 26 December 2018 ML 4.8 earthquakes. |
|
jgrb55894-fig-0002-m.jpg (icon-180)
|
[15.7 KB]
03 Dec 2024, 11:04
|
(a) Average velocity variation of 5-day moving window (dv/v) for all station pairs with its uncertainty (gray error bars). (b) Root Mean Square amplitude of volcanic tremor in velocity (m/s) filtered in the frequency band 0.5–2.5 Hz. (c) Gravity signal observed at SLN station (iGrav#16). (d) Normalized CO2 flux from the volcano flanks, measured by the EtnaGAS network. (e) The SO2 flux measured via FLAME network. (f) The areal strain of the summit area calculated using the EPLU, EPDN, ECPN, and EINT GNSS stations. The vertical dashed red lines show the 23 August Strombolian and 24 December eruption. The dashed green lines indicate the 6 October 2018 ML 4.7 and 26 December 2018 ML 4.8 earthquakes. |
 jgrb55894-fig-0002-m