|
ggac469fig3.gif (icon)
|
[16.91 KB]
03 Dec 2024, 11:05
|
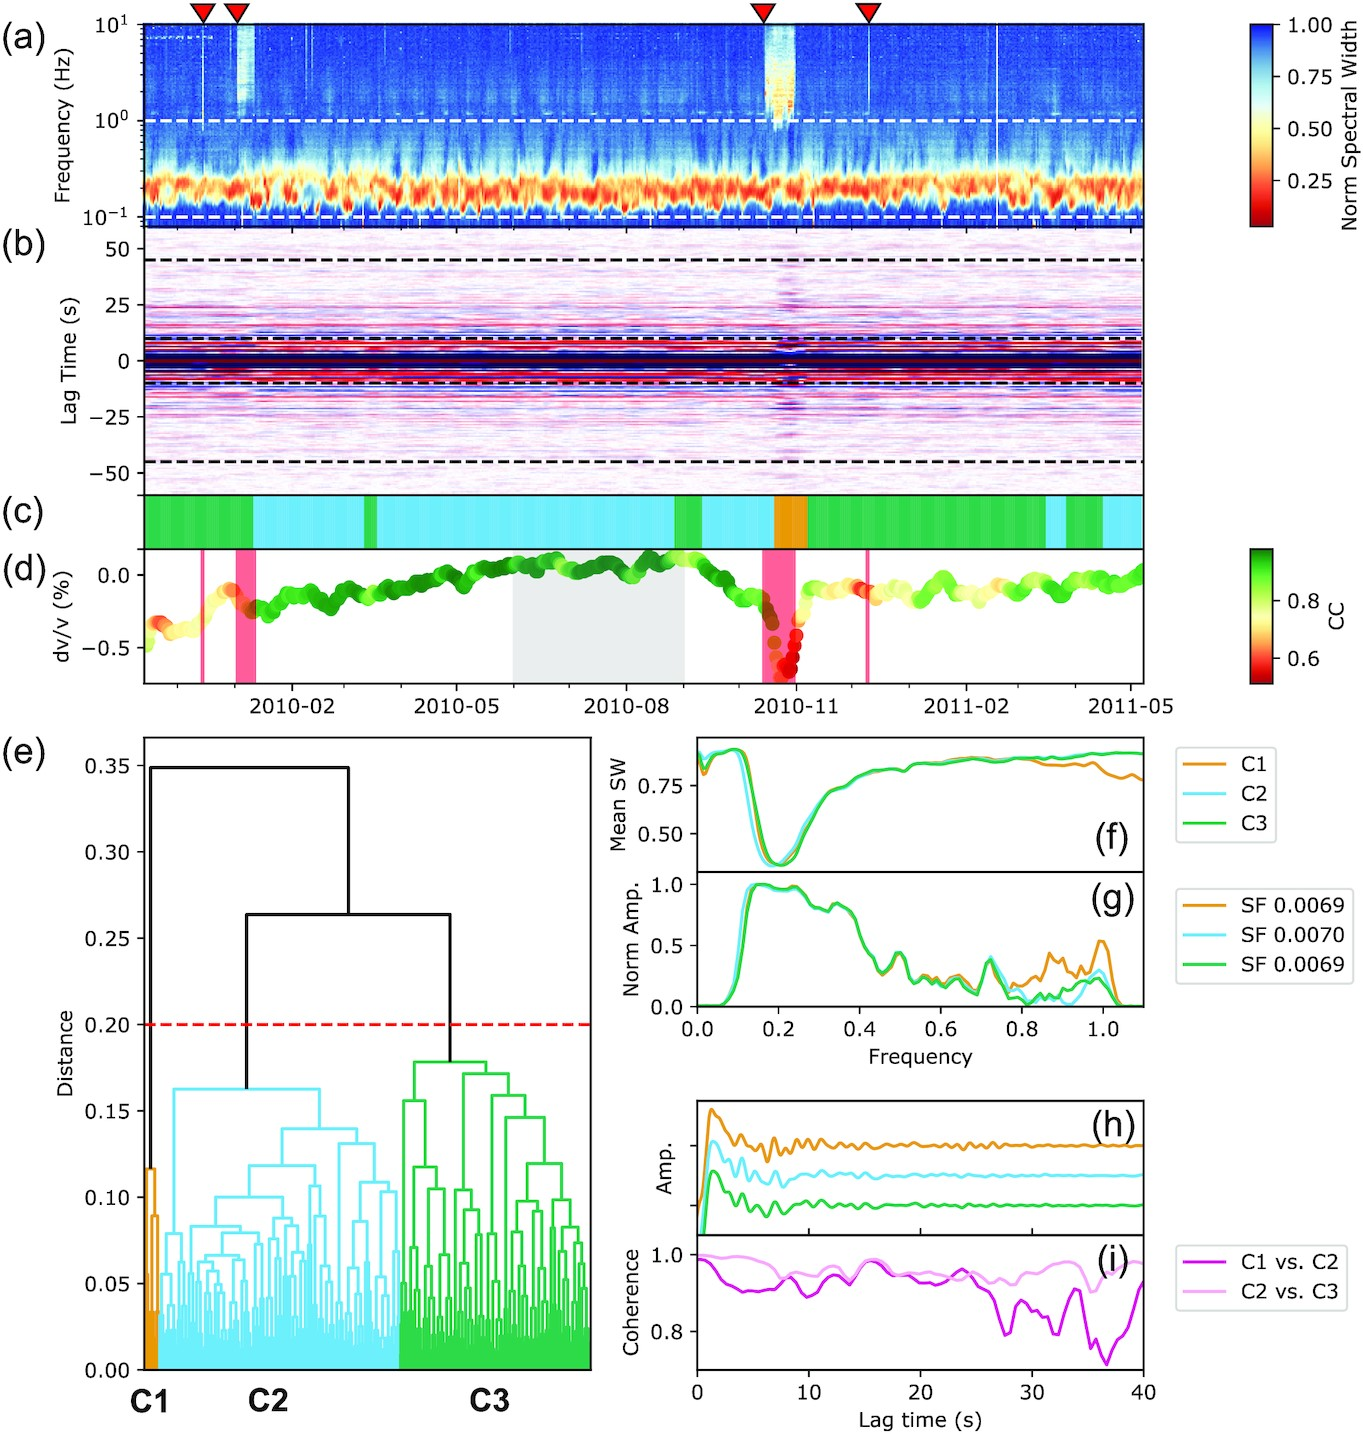
Cluster output using 0.1–1.0 Hz cross-correlation functions (CCFs) for station-pair UV05-UV12 at Piton de la Fournaise (blue line in Fig. 1a). (a) Normalized spectral width measurement. Lower values indicate a more coherent seismic wavefield dominated by fewer seismic sources. Dashed white lines show frequency range of CCFs. Triangles above (red) indicate eruption start times (b) Correlogram showing amplitudes of CCFs at different lag times (red = positive, blue = negative). Dashed black lines show part of CCFs used in clustering. (c) Location of clusters in time, colour-coded according to dendrogram output in (e). (d) Apparent velocity changes, colour-coded according to correlation coefficient (CC) computed between 10-d stacks and the reference stack period (shaded grey). Vertical red bars denote timing of eruptive activity. (e) Dendrogram, with clusters defined at a distance threshold of 0.2 (dashed-red line). (f) Mean value of spectral width as a function of frequency within time period of each cluster. (g) Normalized frequency spectrum of CCFs within each cluster, computed from averaged CCF. Legend shows Scale Factor (SF) to convert from non-normalized spectrum. (h) Average of CCFs within each cluster at positive lag times. (i) Mean coherence, averaged over CCF frequency range, between different clusters at positive lag times, computed using moving window of 10-s length with 0.5 s step (95 per cent overlap). |
|
ggac469fig3.jpg (icon-180)
|
[17.36 KB]
03 Dec 2024, 11:05
|
Cluster output using 0.1–1.0 Hz cross-correlation functions (CCFs) for station-pair UV05-UV12 at Piton de la Fournaise (blue line in Fig. 1a). (a) Normalized spectral width measurement. Lower values indicate a more coherent seismic wavefield dominated by fewer seismic sources. Dashed white lines show frequency range of CCFs. Triangles above (red) indicate eruption start times (b) Correlogram showing amplitudes of CCFs at different lag times (red = positive, blue = negative). Dashed black lines show part of CCFs used in clustering. (c) Location of clusters in time, colour-coded according to dendrogram output in (e). (d) Apparent velocity changes, colour-coded according to correlation coefficient (CC) computed between 10-d stacks and the reference stack period (shaded grey). Vertical red bars denote timing of eruptive activity. (e) Dendrogram, with clusters defined at a distance threshold of 0.2 (dashed-red line). (f) Mean value of spectral width as a function of frequency within time period of each cluster. (g) Normalized frequency spectrum of CCFs within each cluster, computed from averaged CCF. Legend shows Scale Factor (SF) to convert from non-normalized spectrum. (h) Average of CCFs within each cluster at positive lag times. (i) Mean coherence, averaged over CCF frequency range, between different clusters at positive lag times, computed using moving window of 10-s length with 0.5 s step (95 per cent overlap). |
|
ggac469fig3.png
|
[1.41 MB]
03 Dec 2024, 11:05
|
Cluster output using 0.1–1.0 Hz cross-correlation functions (CCFs) for station-pair UV05-UV12 at Piton de la Fournaise (blue line in Fig. 1a). (a) Normalized spectral width measurement. Lower values indicate a more coherent seismic wavefield dominated by fewer seismic sources. Dashed white lines show frequency range of CCFs. Triangles above (red) indicate eruption start times (b) Correlogram showing amplitudes of CCFs at different lag times (red = positive, blue = negative). Dashed black lines show part of CCFs used in clustering. (c) Location of clusters in time, colour-coded according to dendrogram output in (e). (d) Apparent velocity changes, colour-coded according to correlation coefficient (CC) computed between 10-d stacks and the reference stack period (shaded grey). Vertical red bars denote timing of eruptive activity. (e) Dendrogram, with clusters defined at a distance threshold of 0.2 (dashed-red line). (f) Mean value of spectral width as a function of frequency within time period of each cluster. (g) Normalized frequency spectrum of CCFs within each cluster, computed from averaged CCF. Legend shows Scale Factor (SF) to convert from non-normalized spectrum. (h) Average of CCFs within each cluster at positive lag times. (i) Mean coherence, averaged over CCF frequency range, between different clusters at positive lag times, computed using moving window of 10-s length with 0.5 s step (95 per cent overlap). |
|
|
ggac469fig3.gif (icon)
|
[16.94 KB]
03 Dec 2024, 11:01
|
Cluster output using 0.1–1.0 Hz cross-correlation functions (CCFs) for station-pair UV05-UV12 at Piton de la Fournaise (blue line in Fig. 1a). (a) Normalized spectral width measurement. Lower values indicate a more coherent seismic wavefield dominated by fewer seismic sources. Dashed white lines show frequency range of CCFs. Triangles above (red) indicate eruption start times (b) Correlogram showing amplitudes of CCFs at different lag times (red = positive, blue = negative). Dashed black lines show part of CCFs used in clustering. (c) Location of clusters in time, colour-coded according to dendrogram output in (e). (d) Apparent velocity changes, colour-coded according to correlation coefficient (CC) computed between 10-d stacks and the reference stack period (shaded grey). Vertical red bars denote timing of eruptive activity. (e) Dendrogram, with clusters defined at a distance threshold of 0.2 (dashed-red line). (f) Mean value of spectral width as a function of frequency within time period of each cluster. (g) Normalized frequency spectrum of CCFs within each cluster, computed from averaged CCF. Legend shows Scale Factor (SF) to convert from non-normalized spectrum. (h) Average of CCFs within each cluster at positive lag times. (i) Mean coherence, averaged over CCF frequency range, between different clusters at positive lag times, computed using moving window of 10-s length with 0.5 s step (95 per cent overlap). |
|
ggac469fig3.jpeg
|
[422.9 KB]
03 Dec 2024, 11:01
|
Cluster output using 0.1–1.0 Hz cross-correlation functions (CCFs) for station-pair UV05-UV12 at Piton de la Fournaise (blue line in Fig. 1a). (a) Normalized spectral width measurement. Lower values indicate a more coherent seismic wavefield dominated by fewer seismic sources. Dashed white lines show frequency range of CCFs. Triangles above (red) indicate eruption start times (b) Correlogram showing amplitudes of CCFs at different lag times (red = positive, blue = negative). Dashed black lines show part of CCFs used in clustering. (c) Location of clusters in time, colour-coded according to dendrogram output in (e). (d) Apparent velocity changes, colour-coded according to correlation coefficient (CC) computed between 10-d stacks and the reference stack period (shaded grey). Vertical red bars denote timing of eruptive activity. (e) Dendrogram, with clusters defined at a distance threshold of 0.2 (dashed-red line). (f) Mean value of spectral width as a function of frequency within time period of each cluster. (g) Normalized frequency spectrum of CCFs within each cluster, computed from averaged CCF. Legend shows Scale Factor (SF) to convert from non-normalized spectrum. (h) Average of CCFs within each cluster at positive lag times. (i) Mean coherence, averaged over CCF frequency range, between different clusters at positive lag times, computed using moving window of 10-s length with 0.5 s step (95 per cent overlap). |
|
ggac469fig3.jpg (icon-180)
|
[16.02 KB]
03 Dec 2024, 11:01
|
Cluster output using 0.1–1.0 Hz cross-correlation functions (CCFs) for station-pair UV05-UV12 at Piton de la Fournaise (blue line in Fig. 1a). (a) Normalized spectral width measurement. Lower values indicate a more coherent seismic wavefield dominated by fewer seismic sources. Dashed white lines show frequency range of CCFs. Triangles above (red) indicate eruption start times (b) Correlogram showing amplitudes of CCFs at different lag times (red = positive, blue = negative). Dashed black lines show part of CCFs used in clustering. (c) Location of clusters in time, colour-coded according to dendrogram output in (e). (d) Apparent velocity changes, colour-coded according to correlation coefficient (CC) computed between 10-d stacks and the reference stack period (shaded grey). Vertical red bars denote timing of eruptive activity. (e) Dendrogram, with clusters defined at a distance threshold of 0.2 (dashed-red line). (f) Mean value of spectral width as a function of frequency within time period of each cluster. (g) Normalized frequency spectrum of CCFs within each cluster, computed from averaged CCF. Legend shows Scale Factor (SF) to convert from non-normalized spectrum. (h) Average of CCFs within each cluster at positive lag times. (i) Mean coherence, averaged over CCF frequency range, between different clusters at positive lag times, computed using moving window of 10-s length with 0.5 s step (95 per cent overlap). |
|
 ggac469fig3